- Главная
- Разное
- Образование
- Спорт
- Естествознание
- Природоведение
- Религиоведение
- Французский язык
- Черчение
- Английский язык
- Астрономия
- Алгебра
- Биология
- География
- Геометрия
- Детские презентации
- Информатика
- История
- Литература
- Математика
- Музыка
- МХК
- Немецкий язык
- ОБЖ
- Обществознание
- Окружающий мир
- Педагогика
- Русский язык
- Технология
- Физика
- Философия
- Химия
- Шаблоны, фоны, картинки для презентаций
- Экология
- Экономика
Презентация, доклад по английскому языку на тему Kinds of Graphs (6, 7, 8 класс)
Содержание
- 1. Презентация по английскому языку на тему Kinds of Graphs (6, 7, 8 класс)
- 2. People always needed a way to analyze
- 3. Graphs, Charts & DiagramsData can be represented
- 4. The simplest and most straightforward way to
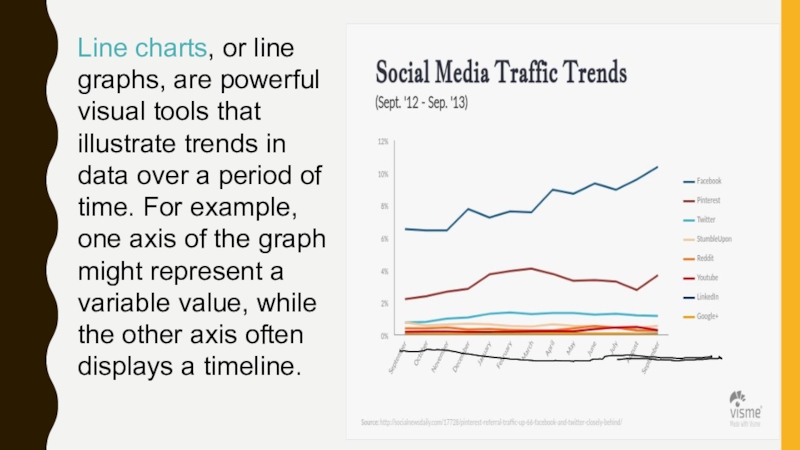
- 5. Line charts, or line graphs, are powerful
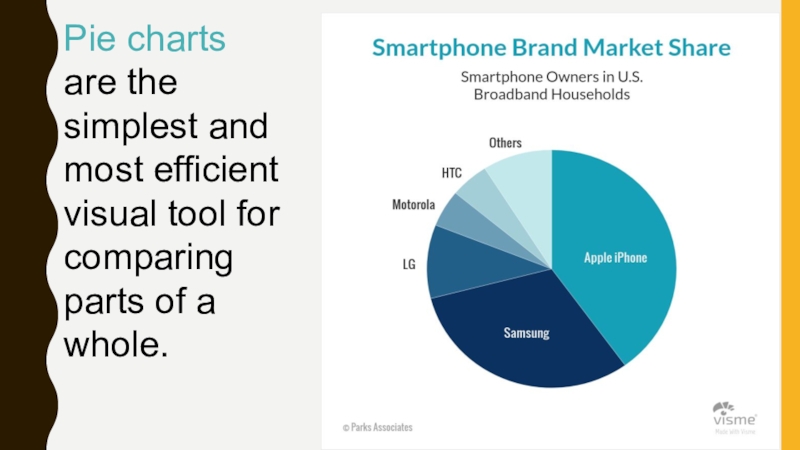
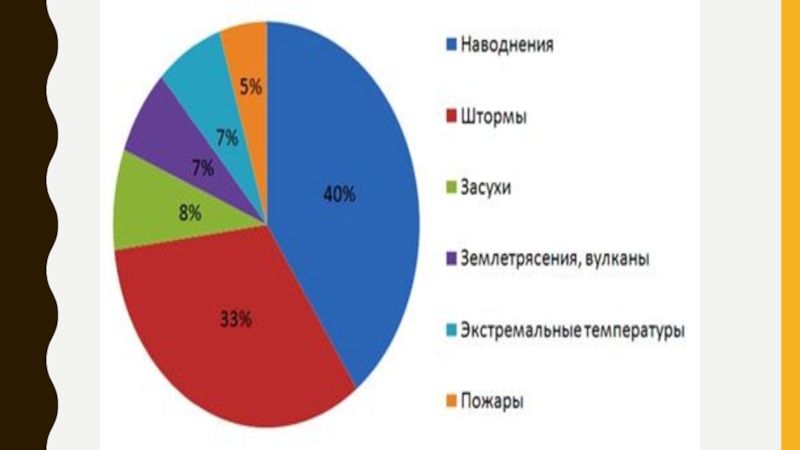
- 6. Pie charts are the simplest and most
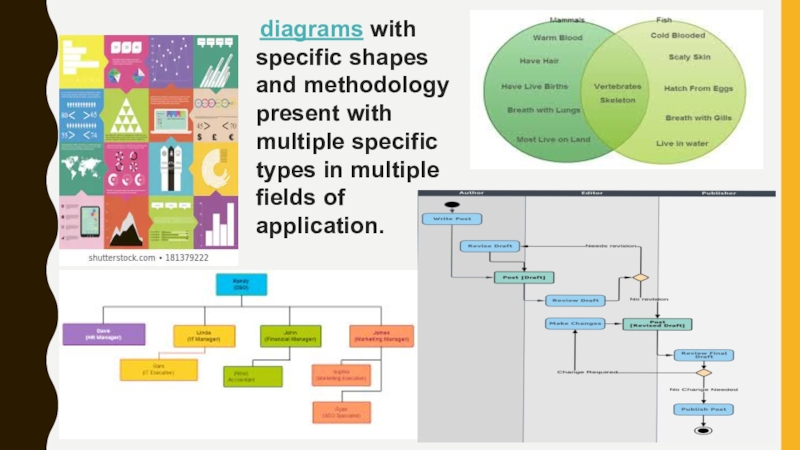
- 7. diagrams with specific shapes and methodology present with multiple specific types in multiple fields of application.
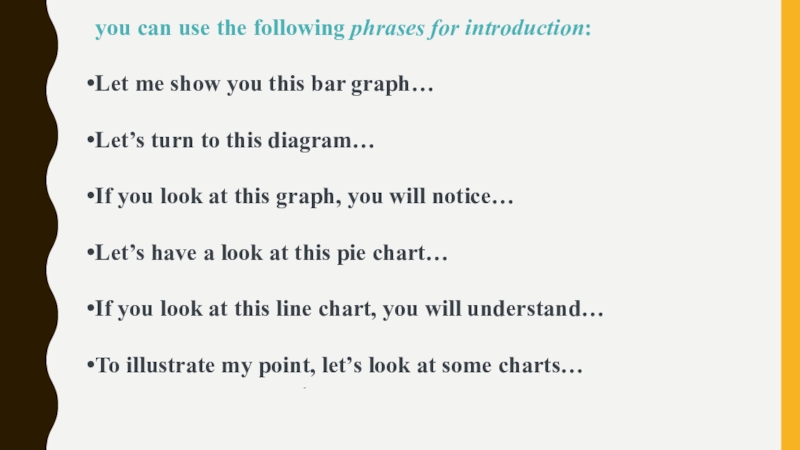
- 8. you can use the following phrases for introduction:Let
- 9. Слайд 9
- 10. Слайд 10
- 11. Слайд 11
People always needed a way to analyze information more easily . By the end of the 18th century, most charts used today -- histograms, pie charts, bar and line graphs -- were already in use, introduced
Слайд 2People always needed a way to analyze information more easily .
By the end of the 18th century, most charts used today -- histograms, pie charts, bar and line graphs -- were already in use, introduced to the world in William Playfair's 1786 publication, "Commercial and Political Atlas." Over the years, statisticians from all walks of life developed and designed additional tools for visually plotting data until modern technology allowed an explosion of new data visualizations in ways never before imagined.
Слайд 3Graphs, Charts & Diagrams
Data can be represented in many ways. The
4 main types of graphs are
a bar graph or bar chart
a line graph
a pie chart
a diagram
a bar graph or bar chart
a line graph
a pie chart
a diagram
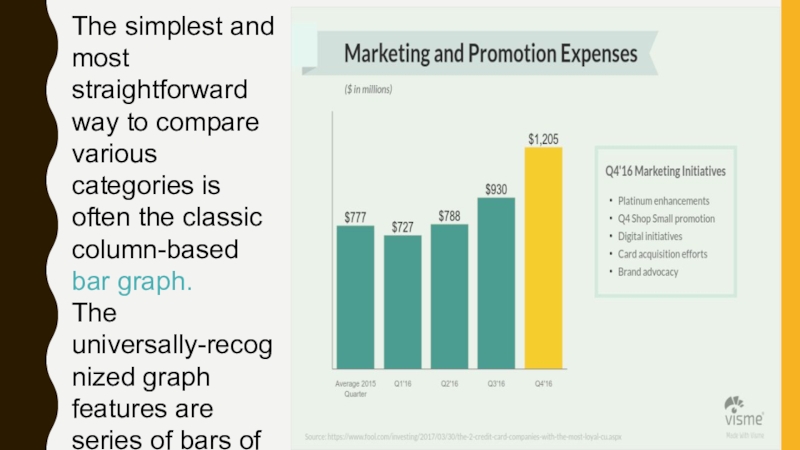
Слайд 4The simplest and most straightforward way to compare various categories is
often the classic column-based bar graph.
The universally-recognized graph features are series of bars of varying lengths.
The universally-recognized graph features are series of bars of varying lengths.
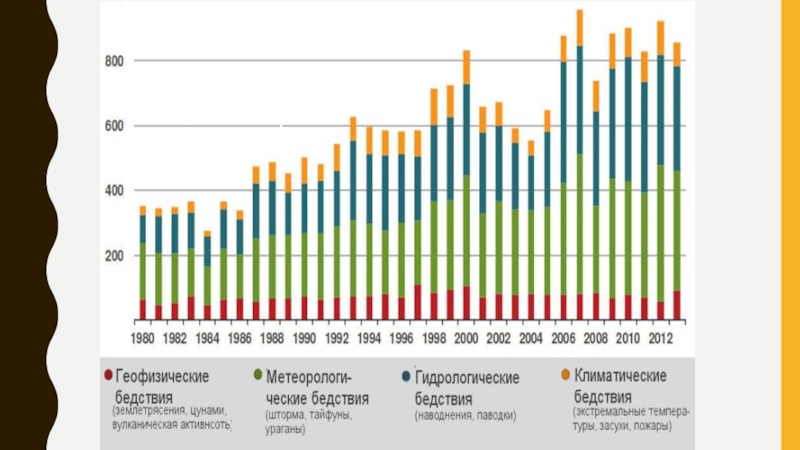
Слайд 5Line charts, or line graphs, are powerful visual tools that illustrate
trends in data over a period of time. For example, one axis of the graph might represent a variable value, while the other axis often displays a timeline.
Слайд 7 diagrams with specific shapes and methodology present with multiple specific types in
multiple fields of application.
Слайд 8you can use the following phrases for introduction:
Let me show you this
bar graph…
Let’s turn to this diagram…
If you look at this graph, you will notice…
Let’s have a look at this pie chart…
If you look at this line chart, you will understand…
To illustrate my point, let’s look at some charts…
Let’s turn to this diagram…
If you look at this graph, you will notice…
Let’s have a look at this pie chart…
If you look at this line chart, you will understand…
To illustrate my point, let’s look at some charts…
